- Photosynthetic Pathway Differences Create Distinct Carbon Signatures
- Isotope Ratio Mass Spectrometry Quantifies Carbon-13 to Carbon-12 Ratios
- Sample Preparation Through EA-IRMS or HPLC-IRMS Configurations
- Mixing Models Calculate Adulteration Percentages Using Binary Equations
- Regulatory Standards and Official Methods Validate Detection Protocols
- Economic Drivers Make Isotopic Testing Cost-Effective for Premium Markets
- Emerging Techniques Combine Isotopic Ratios With Spectroscopic Fingerprinting
- Geographic Origin and the Influence of Local Ecosystems
- Comparative Analysis of C3 and C4 Sugar Sources
- Quality Assurance Protocols in Isotopic Laboratories
- Supply Chain Transparency and Blockchain Integration
- Forensic Analysis of Food Fraud: Case Studies
- The Bottom Line
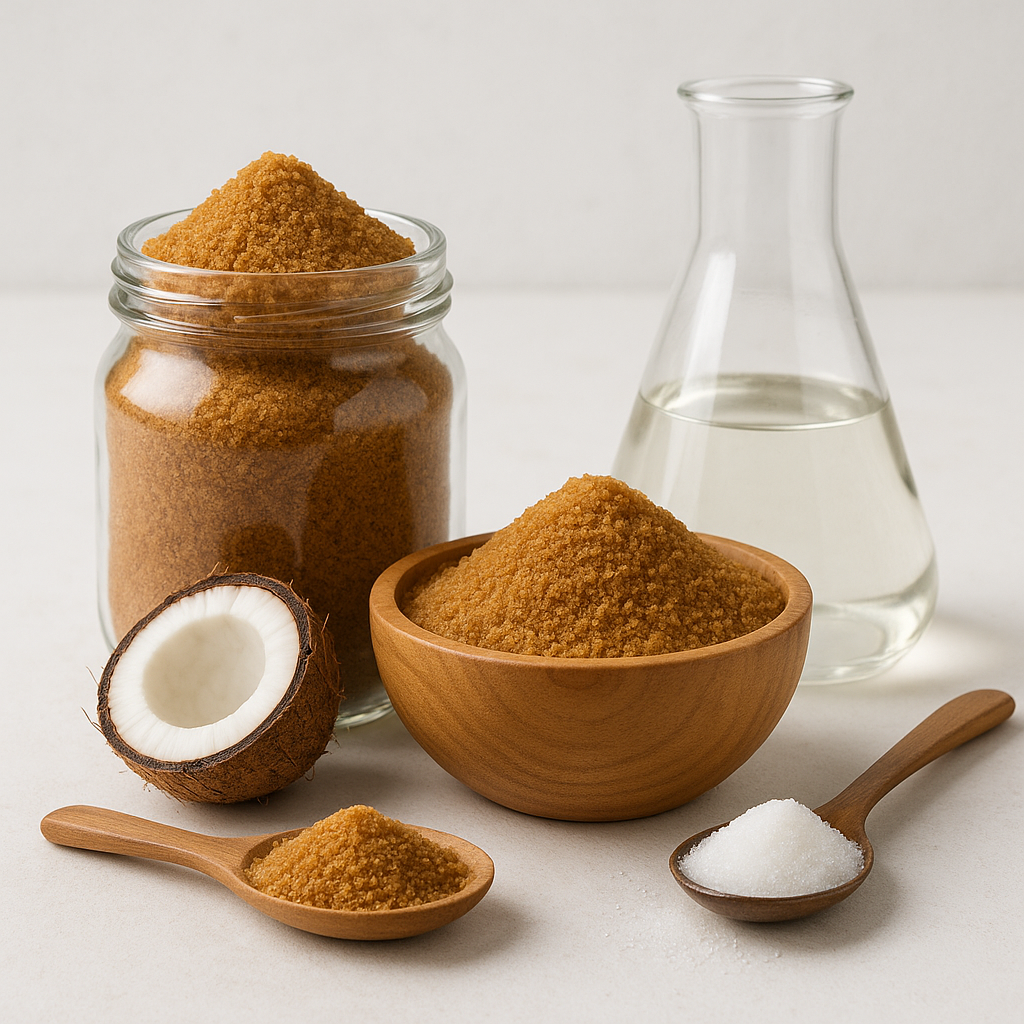
Coconut sugar commands a premium price, which makes it an attractive target for adulteration with cheaper cane sugar. Fortunately, Detecting Cane Sugar Addition in Coconut Sugar has become reliable through carbon isotope ratios. The technique sounds technical, but the underlying idea is fairly intuitive, and it’s worth understanding if you care about what’s actually in your sugar.
Photosynthetic Pathway Differences Create Distinct Carbon Signatures
Different plants fix carbon dioxide using different photosynthetic pathways, and that leaves a permanent mark on the carbon atoms in the sugars they produce. Measuring the ratio of stable carbon isotopes in a sugar sample tells you, in effect, what kind of plant it came from.
Coconut Palms: The C3 Pathway
Coconut palms use the C3 photosynthetic pathway, which discriminates fairly heavily against the heavier carbon-13 isotope during carbon fixation. The result is a δ¹³C value in the range of -33‰ to -22‰—a distinctly negative number that’s a hallmark of authentic coconut sugar.
Sugarcane: The C4 Pathway
Sugarcane, the most common adulterant, uses the C4 pathway instead—a more efficient carbon-fixation strategy that discriminates less against carbon-13. That pushes its δ¹³C values up into a range of -16‰ to -9‰, noticeably less negative than coconut sugar’s.
The C4 pathway is an evolutionary adaptation to hot, arid environments that allows for more efficient carbon capture—and as a side effect, it leaves more carbon-13 in the plant’s tissues, including its sugar. That difference between C3 and C4 plants is the whole basis for Detecting Cane Sugar Addition in Coconut Sugar.
A Stable Fingerprint That Survives Processing
This roughly 10-15‰ separation between C3 and C4 plants isn’t something that gets erased by processing—it’s set during photosynthesis and survives boiling, evaporation, and crystallization intact. That means a lab can measure the δ¹³C value of a finished coconut sugar sample and compare it directly to the known ranges for C3 and C4 plants. Any shift toward the less negative values typical of sugarcane is a red flag for adulteration.
| Characteristic | Coconut Sugar (C3 Pathway) | Cane Sugar (C4 Pathway) |
| Carbon Isotope Discrimination | High (more against carbon-13) | Reduced (less against carbon-13) |
| δ¹³C Values | -33‰ to -22‰ | -16‰ to -9‰ |
| Typical Plant Example | Coconut palm | Sugarcane |
| Role in Detection | Baseline for pure coconut sugar | Indicator of adulteration |
Isotope Ratio Mass Spectrometry Quantifies Carbon-13 to Carbon-12 Ratios
The instrument that actually performs this measurement is an isotope ratio mass spectrometer, or IRMS—precise enough to pick up the kind of small isotopic shifts that adulteration causes.
How IRMS Works
The process starts by combusting the sugar sample into CO₂ gas. The resulting ions are then separated by mass-to-charge ratio, which lets the instrument measure the ¹³C/¹²C abundance to a precision of about 0.1‰.
The VPDB Standard and Delta Notation
Every sample’s isotopic composition is measured against a universal reference point: the Vienna Pee Dee Belemnite (VPDB) standard. Results are expressed as “delta notation,” written δ¹³C, in parts per thousand (‰).
| VPDB Standard | A universally recognized carbonate fossil used as the baseline for carbon isotope measurements, allowing results to be compared across labs and studies worldwide. |
| δ¹³C (Delta Notation) | The relative difference between a sample’s ¹³C/¹²C ratio and the VPDB standard. A more negative value means less ¹³C relative to the standard. |
Because the scale is standardized, a δ¹³C reading from one lab means the same thing as a reading from another—which is what makes it possible to flag even subtle shifts in isotopic profile as a sign of adulteration.
Sensitivity: Detecting Additions as Low as 5-10%
The whole analysis needs only 0.5-2 mg of purified sugar, and by measuring thousands of molecules at once, the method can reliably detect cane sugar additions as low as 5-10%—low enough to catch adulteration that would otherwise go unnoticed, and precise enough to be a real tool for quality control.
Sample Preparation Through EA-IRMS or HPLC-IRMS Configurations
There are two main ways to prepare and run a sample: EA-IRMS (Elemental Analyzer-IRMS) and HPLC-IRMS (High-Performance Liquid Chromatography-IRMS). Each has its own strengths.
EA-IRMS: Bulk Analysis
EA-IRMS combusts the entire sugar sample at around 1020°C in an oxygen-rich environment, producing a single bulk δ¹³C value for the whole sample. It’s fast, which makes it a good first-pass screening tool.
HPLC-IRMS: Compound-Specific Analysis
HPLC-IRMS goes a level deeper. It first separates the individual sugars—sucrose, glucose, fructose—using liquid chromatography, then combusts each one separately for isotope measurement. That means you get a δ¹³C value for each sugar component individually, rather than one averaged number for the whole sample. This matters because compound-specific differences can be masked entirely in a bulk measurement.
Spotting Blends Through Isotopic Heterogeneity
In pure coconut sugar, the sucrose, glucose, and fructose fractions all show roughly the same δ¹³C value—a natural consequence of how the plant’s metabolism works. Add cane sugar, though, and its distinct C4 signature shows up differently across those fractions depending on how it was added, whether as straight sucrose or as inverted sugar. That inconsistency across components is itself strong evidence of blending.
Mixing Models Calculate Adulteration Percentages Using Binary Equations
Once you know the δ¹³C values for pure coconut sugar and pure cane sugar, you can go a step further and actually calculate what percentage of a sample is adulterant, using a simple binary mixing equation. This mathematical approach strengthens Detecting Cane Sugar Addition in Coconut Sugar by quantifying the extent of adulteration.
The Mixing Equation
The equation is: δ¹³Cmixture = (f × δ¹³Ccane) + ((1-f) × δ¹³Ccoconut), where f is the fraction of cane sugar. Plug in the known values for pure coconut and pure cane sugar along with the measured value of the mixture, and you can solve directly for f.
Typical Reference Values
In practice, authentic coconut sugar typically measures -26‰ to -28‰, while pure cane sugar comes in around -12‰ to -13‰. These two values serve as the “end-members” in the mixing model—without them as reference points, there’s nothing to solve the equation against.
Worked Example
Say a sample measures -22‰—a value that falls between the pure coconut and pure cane ranges. Running it through the mixing equation puts that sample at roughly 27-36% cane sugar, assuming no fractionation occurred during blending. That’s the kind of concrete number a lab can hand back to a producer or regulator. [source]
Regulatory Standards and Official Methods Validate Detection Protocols
This isn’t a fringe method—it’s backed by established regulatory frameworks.
AOAC Protocols
The Association of Official Analytical Chemists (AOAC) has established protocols for stable isotope analysis in food authentication, including specific guidance for plant-derived sugars—giving labs a standardized procedure to follow.
Growing Regulatory Requirements
European and international food safety authorities increasingly require isotopic verification for any product labeled as a single botanical origin—including coconut sugar. This kind of scrutiny is part of what keeps the premium end of the market honest.
ISO 17025 and Lab Accreditation
Standardized methods also specify things like sample size and replication—typically triplicate analysis—plus require that testing labs hold ISO 17025 accreditation. That accreditation is essentially a guarantee that a lab has the technical competence and management systems needed to produce results that hold up.
Economic Drivers Make Isotopic Testing Cost-Effective for Premium Markets
The economics here are pretty stark, and they explain both why adulteration happens and why Detecting Cane Sugar Addition in Coconut Sugar makes financial sense.
The Price Gap Creates the Incentive
Coconut sugar typically sells for 3-5 times the price of conventional cane sugar, largely on the strength of its perceived health benefits. That gap is exactly the kind of incentive that tempts unscrupulous suppliers to cut it with cheaper cane sugar.
Testing Is Cheap Compared to the Alternative
A single IRMS test runs about $50-150 per sample. Compare that to the cost of a regulatory penalty for an authenticity violation, which can run well into the thousands, not to mention the damage to a brand’s reputation if a product gets flagged as adulterated. For producers serious about authenticity, the test is cheap insurance.
Routine Screening as a Deterrent
Some high-volume producers test 5-10% of their production lots routinely. Even at that rate, it sends a clear signal to suppliers throughout the chain that quality control is being checked—which on its own discourages adulteration from creeping in.
Emerging Techniques Combine Isotopic Ratios With Spectroscopic Fingerprinting
IRMS isn’t the only tool in the toolbox anymore. Newer approaches combine isotopic analysis with spectroscopic methods for a more layered picture, and some of them are worth knowing about.
Adding Hydrogen and Oxygen Isotopes
Combining δ¹³C with hydrogen (δ²H) and oxygen (δ¹⁸O) isotope ratios creates a multi-dimensional signature that’s tied to geographic origin, not just plant type—which makes the overall picture much harder to fake.
| Isotopic Ratios for Authentication | |
|---|---|
| δ¹³C | Identifies C3 vs. C4 plant origins. |
| δ²H | Reflects local rainfall and climate. |
| δ¹⁸O | Indicates water source and evaporation rates. |
Spectroscopy as a Quick First Pass
Near-infrared and Raman spectroscopy offer a fast, non-destructive way to scan a sample’s chemical fingerprint before committing to the slower, more expensive IRMS analysis. A sample with a spectral pattern that deviates from pure coconut sugar gets flagged for confirmatory testing, while the rest can skip straight through—which makes the overall screening process a lot more efficient.
NMR for Catching Sophisticated Adulteration
NMR spectroscopy goes even further, providing a detailed molecular snapshot that can detect trace metabolites and different sugar forms (anomers) present in different ratios between coconut and cane sources. Minor sugars or organic acids that are characteristic of genuine coconut sugar but absent—or present in different proportions—in cane sugar act as additional markers, catching even very sophisticated attempts at blending. [source]
Geographic Origin and the Influence of Local Ecosystems
Where a coconut sugar comes from also leaves a trace, since local ecosystems imprint their own isotopic signatures on the sap.
Isoscape mapping for coconut production regions in Southeast Asia
Researchers are building “isoscape” maps of Southeast Asian coconut-growing regions—visual maps of how stable isotope ratios vary by geography, which can serve as a baseline for authenticity checks.
Influence of coastal versus inland cultivation on stable isotope ratios
Coastal palms, exposed to sea spray and brackish water, tend to show different isotope ratios than inland ones—the water available to the palm directly affects the sugars it produces. These regional variations add another layer of data when assessing a sample’s origin and purity.
Trace element analysis as a secondary validator for regional provenance
Trace element analysis adds a useful secondary check. The mineral composition of local soil—reflected in ratios of elements like strontium, barium, or magnesium—gets absorbed by the palm and ends up in the sugar, which can help pinpoint the cultivation region. Combined with isotopic data, it gives a more complete picture of where a sample actually came from.
Comparative Analysis of C3 and C4 Sugar Sources
It’s worth stepping back and comparing how this plays out across different sugar sources, not just coconut versus cane.
Distinguishing coconut sugar from beet sugar (C3) and corn syrup (C4)
Beet sugar is also a C3 plant product, so its isotope ratios overlap with coconut sugar’s—the C3/C4 test alone can’t tell them apart. Corn syrup, on the other hand, comes from a C4 plant, so it’s distinguishable the same way cane sugar is.
Isotopic overlap challenges in complex multi-sweetener blends
Things get harder when multiple sweeteners are blended together, since their isotopic ranges can overlap and make quantification ambiguous. In these cases, the compound-specific analysis mentioned earlier—measuring δ¹³C for each sugar fraction individually rather than relying on a bulk number—becomes necessary to pin down what’s actually in the mix.
Kinetic isotope effects during the high-heat evaporation of coconut sap
One wrinkle worth knowing about: the high heat used in evaporating coconut sap can itself slightly shift δ¹³C values, since lighter isotopes evaporate a bit more readily and leave the remaining sugar slightly enriched in heavier ones. Accounting for this is important to avoid false positives or negatives—which is why reference samples of authentically processed coconut sugar are so valuable for establishing a realistic baseline.
Quality Assurance Protocols in Isotopic Laboratories
None of this matters if the lab work itself isn’t rigorous, so a few quality assurance practices are worth understanding too.
Calibration against international reference materials (IAEA standards)
Instruments need regular calibration against certified international reference materials, such as IAEA standards, so that measurements taken in one lab are directly comparable to those taken anywhere else.
Minimizing atmospheric CO2 contamination during sample combustion
Atmospheric CO2 has its own isotopic signature, and if any leaks into the combustion chamber during sample preparation, it can subtly skew results in ways that obscure exactly the differences the test is trying to detect. Labs control for this with high-purity oxygen, leak-tight systems, and careful monitoring of background signals.
Statistical validation of detection limits and quantification limits (LOD/LOQ)
Finally, every method needs statistically validated detection and quantification limits (LOD/LOQ)—the lowest concentration of cane sugar it can reliably flag versus the lowest it can reliably quantify. Labs establish these by running large numbers of blank and spiked samples at varying concentrations, which is what gives a stated detection limit its credibility. [source]
Supply Chain Transparency and Blockchain Integration
Testing is one piece of the puzzle; tracking is another. Some producers are now pairing isotopic testing with blockchain-based record-keeping to create an immutable trail for each batch from farm to consumer.
Digital ledgers for recording isotopic signatures from farm to fork
Recording each batch’s carbon isotope ratio on a secure digital ledger creates a permanent, traceable record—so authenticity can be checked at any point along the chain, not just at the end.
The role of third-party certification bodies in verifying sugar purity
Independent certification bodies add another layer, conducting their own audits and lab testing, cross-referencing isotopic signatures against established benchmarks. Their seal of approval gives consumers an objective, third-party assurance that a product has actually been checked—which goes a long way toward reducing mislabeling and fraud across the market.
Impact of isotopic verification on consumer trust and market growth
Verifiable proof of purity matters increasingly to consumers, who are demanding authenticity and ethical sourcing alongside quality. Producers who can back up a “no cane sugar added” claim with actual isotopic data have a real differentiator—one that translates into consumer trust and, often, market share.
Forensic Analysis of Food Fraud: Case Studies
The kind of scenario this testing protects against isn’t hypothetical. A few of the patterns that show up repeatedly in food fraud investigations:
- Products marketed as “pure” turning out to contain substantial amounts of added cane sugar, discovered through routine isotopic testing rather than any visible difference.
- Premium sugars diluted with cheap industrial cane sugar at scale, caught because the blended product’s δ¹³C value drifted noticeably toward the C4 range.
- “Artisanal” sweeteners sold online that turn out to be mostly cane sugar, with δ¹³C readings squarely in cane sugar territory rather than anywhere near authentic coconut sugar’s range.
- Organic certifications revoked after routine audits—including isotopic testing—turned up a consistent pattern of cane sugar addition that couldn’t be explained any other way.
Detecting high-fructose corn syrup (HFCS) in organic coconut nectar
High-fructose corn syrup is another C4-derived sweetener that sometimes turns up where it shouldn’t—including in products marketed as organic coconut nectar. Isotopic analysis catches this the same way it catches cane sugar, since corn is also a C4 plant.
Identifying “dilution” of premium palm sugars with industrial cane sugar
Diluting an expensive palm sugar with cheap industrial cane sugar is one of the more common forms of economic adulteration, simply because the margins make it tempting. Detecting Cane Sugar Addition in Coconut Sugar through isotopic analysis draws a clean line here too—the C3 signature of authentic palm sugar versus the C4 signature of added cane sugar isn’t ambiguous.
Legal implications and consumer protection lawsuits involving mislabeled sweeteners
Mislabeling carries real legal weight—regulatory fines, product recalls, and in some cases consumer class-action lawsuits when buyers feel they paid for something they didn’t get. All of which reinforces why accurate labeling, backed by testing that can actually verify it, matters to everyone in the supply chain.
The Bottom Line
Detecting Cane Sugar Addition in Coconut Sugar through carbon isotope analysis provides a reliable, science-backed approach to authenticity verification. The method leverages fundamental differences in plant photosynthesis—C3 versus C4 pathways—that leave permanent isotopic fingerprints surviving all processing steps. With detection limits as low as 5-10% adulteration, the technique protects both producers who invest in genuine products and consumers who pay premium prices for authenticity. When paired with emerging tools like compound-specific IRMS, multi-isotope profiling, and blockchain traceability, isotopic testing forms the backbone of a comprehensive quality-assurance strategy. For an industry where visual inspection alone cannot distinguish authentic from adulterated products, Detecting Cane Sugar Addition in Coconut Sugar through validated laboratory methods remains an essential safeguard maintaining market integrity.